Our products and services
A more detailed look
Most people don’t fully appreciate the role export-import trade plays in the everyday lives of people around the world. You do.
We want to work with you to give you an edge. Our goal is to arm you with the most accurate, up-to-date U.S. government data, each and every month. We succeed if you are able to make better, more profitable decisions with our data.
We have tailored our options to fit your needs and your budget:
Content syndication
Monthly data updates for your airport, seaport, border crossing or trade organization website.
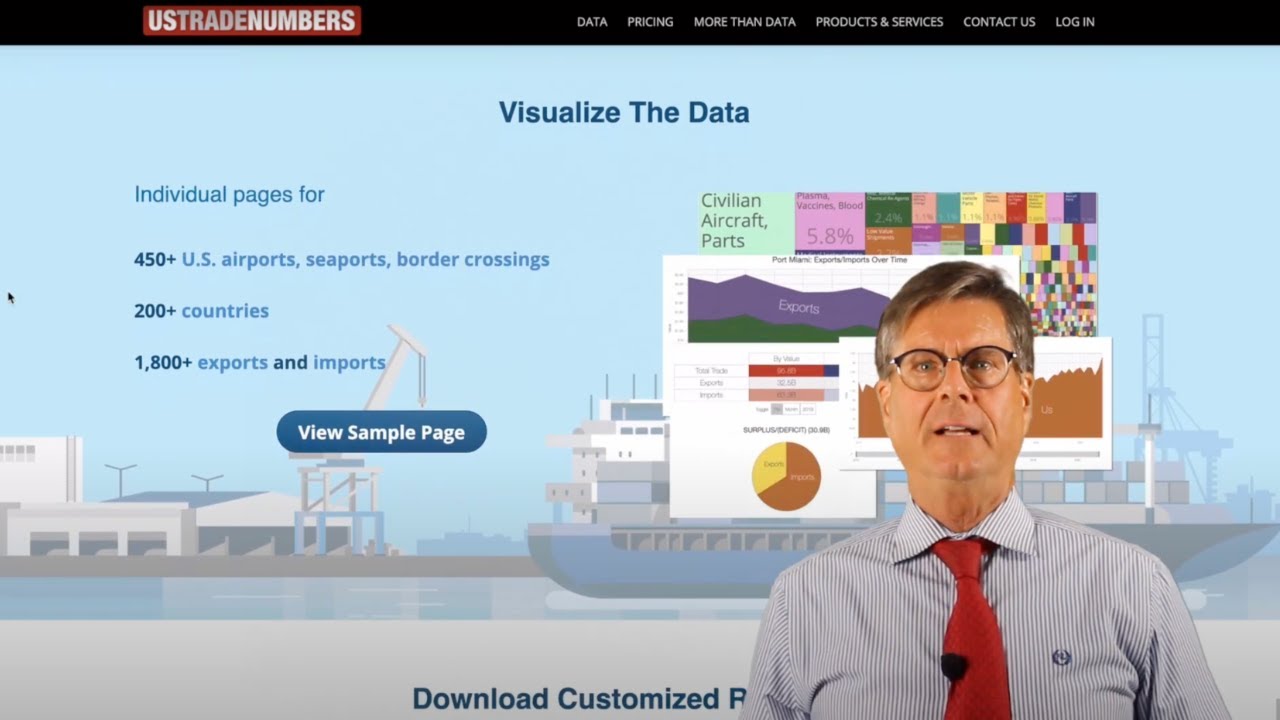
If you represent an airport, seaport or border crossing, we offer a great way to add relevant content to your site every month – the latest data for your airport, seaport or border crossing taking advantage of data visualization techniques.
It includes the percentage of your trade by country, by exports and imports, with the ability to shift between the current month, year to date or the latest annual data. Value or tonnage for each country, export or import. National ranking by value and tonnage, compared to all U.S. trade gateways as well as within your specific transportation mode – air, ocean or land. It includes an analysis of the changes among the top five trade partners, exports and imports.
And it’s a simple, turn-key solution.
It’s a great way to help you maintain, support and build your international trade community of shippers, logistics companies, service providers, transportation companies and more.
Our content syndication can also be an opportunity for trade associations that deal with a specific U.S. export or import or a specific country and its relationship with the United States.
Content Syndication samples:
Content Syndication will also open your page on our website for anybody to see, check out a few samples:
Contact us at 305-441-2244 or at info@ustradenumbers.com for more information.
Personalized, Custom Videos
Our customized and personalized videos offer a great opportunity for
- Staying in close contact with current customers, community trade leaders, local oversight boards and others on a regular basis,
- Building new relationships at trade shows or during conference presentations,
- Enhancing your website with great content.
We even have three versions – an overview, one that focuses on exports and one that focuses on imports, so they can be rotated.
Working closely with us, we can help you send emails to as many people each month as you would like, each personalized with his or her name and with the port’s data you would like them to see.
Or, let your members of your business development team have visitors to their trade show or conference booth complete an online form to immediately see a video with their name in it – with your port’s data. From there, with solid prospects, they can follow up with another video the next month and the one after.
Finally, this is a great way to spruce up your website with lively, animated, colorful and detail-rich content, playing in loop for visitors to the cargo section of your website. While not personalized, the content remains strong and current. Historical videos here.
Data subscription
We offer four types of annual data subscriptions: (1) Basic, (2) BasicPlus with downloading ability, (3) Premium and (4) PremiumPlus with downloading ability
Basic Data Subscription
While this is our entry-level option, it comes with a stunning amount of information, updated monthly, rich with insights. The cost is about $13 per month.
You pick your choice from among more than 450-plus U.S. airports, seaports or border crossings. Or from among more than 225 countries with which the United States trades. Or more than 1,800 specific U.S. export and import commodities.
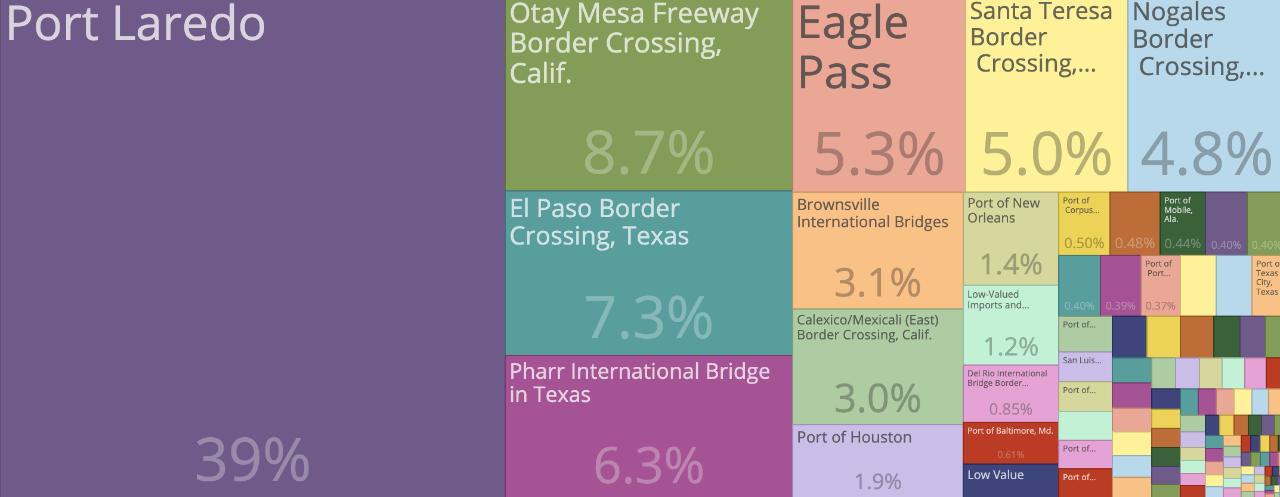 Let’s say you need to follow U.S. trade with Mexico. Each month, in addition to the dashboard overview available to everyone, we will provide you with striking data visualizations making it easy to assess the leading U.S. airports, seaports and border crossings involved in that trade, with the percentage of the total for each.
You can decide if you want to view it for the current month, year-to-date or the latest annual time period. You can toggle between value or tonnage.
The export and import sections for U.S. trade with Mexico are set up the same basic ways. Look at the U.S. exports to Mexico, by market share, value, tonnage and the time period that best serves your needs.
You will also find an “area chart” that shows the monthly total for U.S. exports and imports with Mexico and a pie chart that shows the relationship between U.S. exports and imports.
The page is completed with a 250-word analysis of the trade, including specific information on the top five U.S. ports, top five exports and top five imports.
If your interest is one of the nation’s airports, seaports or border crossings – the Port of Los Angeles, for example -- the level of information is virtually identical. In addition to detail on its leading exports and imports, you will find a wealth of information about its leading trade partners. In addition, you will find a data visualization that shows the relationship
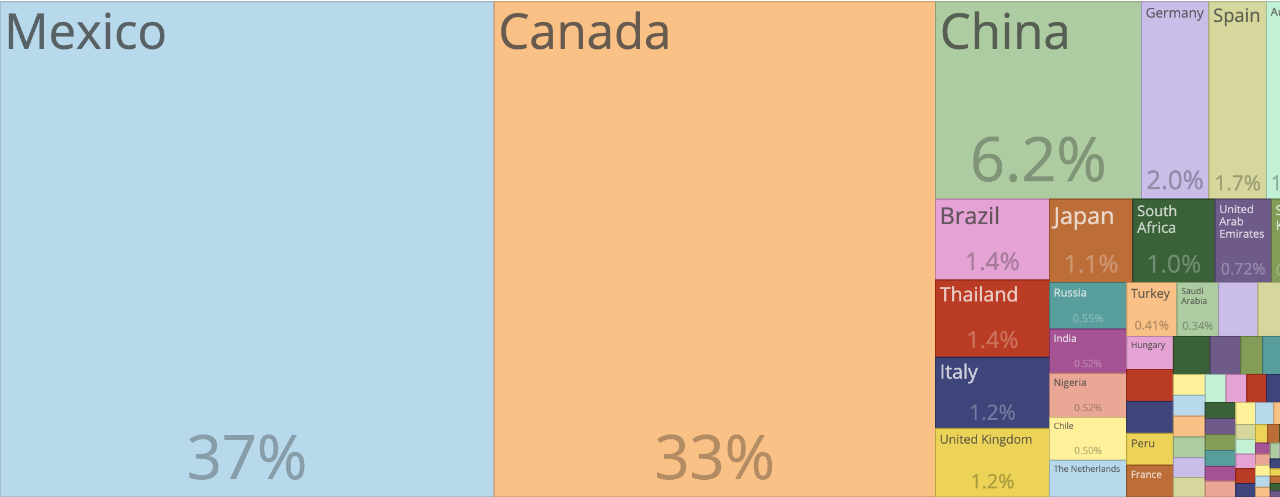 You can also pick from hundreds and hundreds of specific exports or imports. For example, if you need to track exports of motor vehicle parts, you can subscribe to that page. Each month, you will find the percentage of exports going to each country, viewed by your choice of the three time periods, by value and tonnage. You will also be able to determine through which U.S. airports, seaports and border crossings those motor vehicle parts passed, with the same ability to change the time period and between value and tonnage.
Our data is delivered at the four-digit harmonized tariff schedule level, and we provide a glossary if you know the four-digit code.
But wait. What if you need more than one log-in? Discounts are available beyond the $165 annual rate if you need more than one person on the account. Those options are available by reaching out to info@ustradenumbers.com.
Or what if you need to pick more than one port, country or commodity?
Let’s say you need to follow your seaport and a competitor, or a border crossing and a country important to that border crossings, or two countries, two ports and three commodities. We offer discounts here also. Those options are available by reaching out to info@ustradenumbers.com.
BasicPlus Data Subscription with downloading
At this level, we provide you everything listed in the BasicPlus Data Subscription above plus the ability to download incredible volumes of historical data. It will provide a much richer overview of that trade, with the ability to see trends, large swings up or down. The cost is about $120 per month.
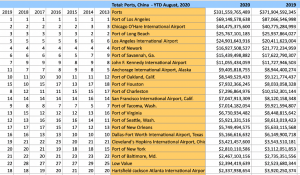
Click image to download a sample file of trade with China
For example, let’s say you are paying attention to China’s trade with the United States.
Each month, for whichever port, country or commodity you have chosen, you will be able to download up to six Excel spreadsheets detailing trade for up to eight years. That’s right, eight years.
At the top, we will show you the market share for the top 15 ports.
Beneath that you will have total trade, total exports, total imports, the surplus or deficit, and the ratio of exports to imports.
You can download it by any of three time periods – current month, year-to-date or latest annual. You can download it by value or tonnage. For each port, we will offer the rank for each of those eight years, the value or tonnage change and the percentage of those changes.
There’s more. You will also be able to down the hundreds and hundreds of U.S. exports to China. Again, there will be eight years of data. Market share for the top 15 across the top. Followed by a ranking by value or tonnage for them all. You pick your time period. Each one ranked for every year. Each with the change from year by year, with the percentage change.
There’s still more. Just as is the case for U.S. exports to China, you will be able to download U.S. imports from China. Same level of incredible detail.
If it’s a port in which you are interested – the Port of Savannah, for example – there are an equivalent number of options for downloads.
The same holds for a specific import, such as computers, berries or oil, or export.
All told, more than 200 charts available for download with each subscription at a cost of only $1,450 per year. You can learn about multiple logins or some combination of ports, countries or commodities on the subscription page.
Premium Data Subscription
If you need a much deeper level of understanding and detail about a particular country, airport, seaport, border crossing or commodity, this is where you belong.
This subscription offers all the details available with the Basic Data Subscription but then allows you to dig deeper.
With just a single subscription, you would have access to up to 80,000 different charts each month. At a cost of less than $160 per month.
If, for example, your primary interest is the Port of Charleston, with the Basic Data Subscription, you can see the relative importance of its trade partners and the total for the current month, year to date and the most recent annual data. You can see the data by value or tonnage. You can also see its exports and imports, with proportional and actual values.
With the Premium Data Subscription, you can drill down to the next level.
You can determine, for example, the Port of Charleston’s trade with Germany specifically -- see the hundreds and hundreds of exports and imports, including the percentage of the total, value and tonnage, for the same three time periods.
But we have added a great data set here, at this level. You can also learn how important the Port of Charleston is for trade with Germany relative to the nation’s other airports, seaports and border crossings, by value and tonnage, for the current month, year to date, or latest annual period. And you can even isolate it against just other seaports – or airports and border crossings, should that be your interest.
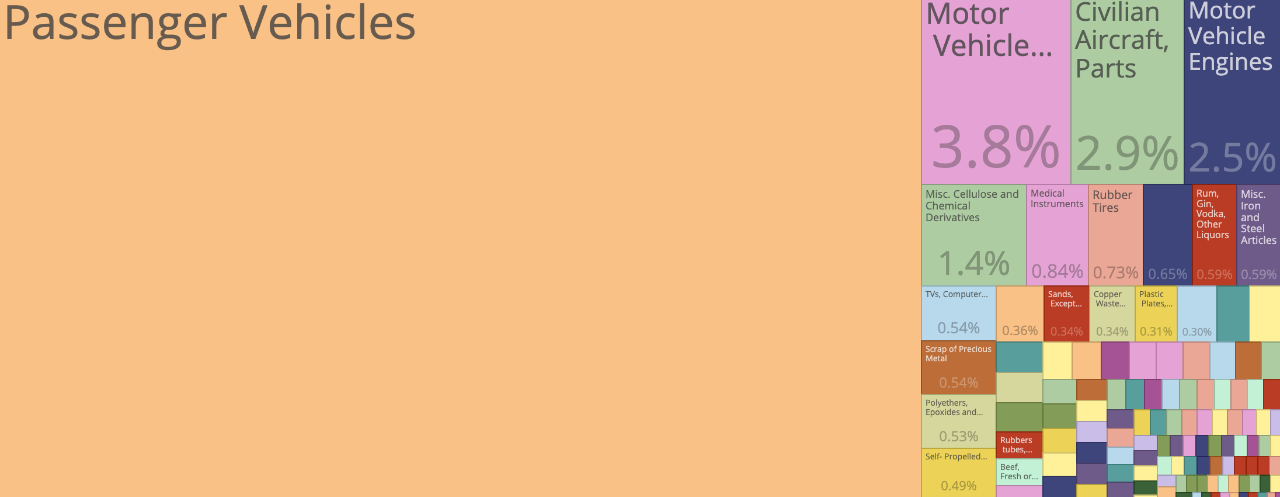
Still working with the Port of Charleston, the same additional level of detail is available for the hundreds and hundreds of exports or imports. For example, you could be interested in knowing more about its motor vehicle exports.
Here, the next level of data would tell you which countries were buying motor vehicles from Charleston and at what relative percentage and value in your specified time period. It would also tell you the other U.S. airports, seaports and border crossings motor vehicles were passing through – and at what percentage and value.
If your interest is a specific country, you will get everything described above, though you would be seeing a list of ports rather than countries.
If your interest is a specific export, say cotton, you would be able to drill down to see for each country receiving it, the value or tonnage for each airport, seaport or border crossing – with control over the time period and the value or tonnage.
Similarly, you would be able to look at each airport, seaport or border crossing to determine which one handled U.S. cotton exports to which country.
The same would hold true for our hundreds and hundreds of import categories.
In truth, it can be difficult to get your arms around the level of data here.
For $1,950 a year, this is a great value, given the depth of the data available to you.
This subscription does come with additional login discounts as well as discounts for additional ports, countries or commodities. You can see those discounts by reaching out to info@ustradenumbers.com.
PremiumPlus Data Subscription with downloading
This membership is for the business executive or organization serious about having access to the best, most-detailed, most up-to-date and historical information available.
Not only can you have access to more than 80,000 charts each month, which comes with the PremiumPlus Data Subscription, you will be able to download Excel charts with up to eight years of data for each one. Yes, up to eight years. All for less than $415 per month.
Before we offer a couple of examples, here’s a quick reminder of what the Premium Data Subscription offers:
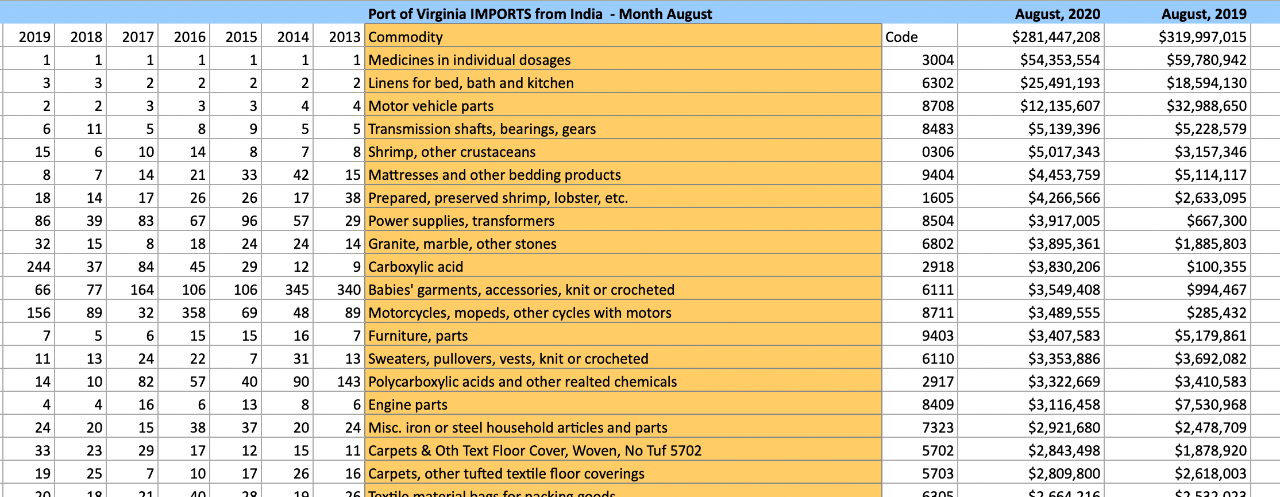
Click image to download report
Let’s say your primary interest is the Port of Virginia, with the Basic Data Subscription, you can see the relative importance of its trade partners and the total for the current month, year to date and the most recent annual data. You can see the data by value or tonnage. You can also see its exports and imports, with proportional and actual values.
With the Premium Data Subscription, you can drill down to the next level.
You can determine, for example, the Port of Virginia’s trade with India specifically -- see the hundreds and hundreds of exports and imports, including the percentage of the total, value and tonnage, for the same three time periods.
But we have added a great data set here, at this level.
You can also learn how important the Port of Virginia is for trade with India relative to the nation’s other airports, seaports and border crossings, by value and tonnage, for the current month, year to date, or latest annual period. And you can even isolate it against just other seaports – or airports and border crossings, should that be your interest.
That’s the Premium Data Subscription without downloads. Add in the ability to download Excel documents and you advance to another level.
Here are a couple of examples.
Let’s say you have subscribed to the oil export section and noticed a surge in oil exports from the United States. With this subscription not only can you determine which ports are sending oil to which countries and which countries are getting their oil from which ports, you can download charts for both of those and see how those flows have changed year-to-date over the last eight years.
Or perhaps you are a subscriber to the Japan section and want to determine if there have been any shifts in motor vehicle imports by the port of entry over the last eight years. Is the expansion of the Panama Canal leading to more service to the East Coast?
At $4,950 per year, it offers a stunning among of data, all of which can be not only downloaded but manipulated.
This subscription does come with additional login discounts as well as discounts for additional ports, countries or commodities. You can see those discounts by reaching out to info@ustradenumbers.com.
TradeNumbers publications
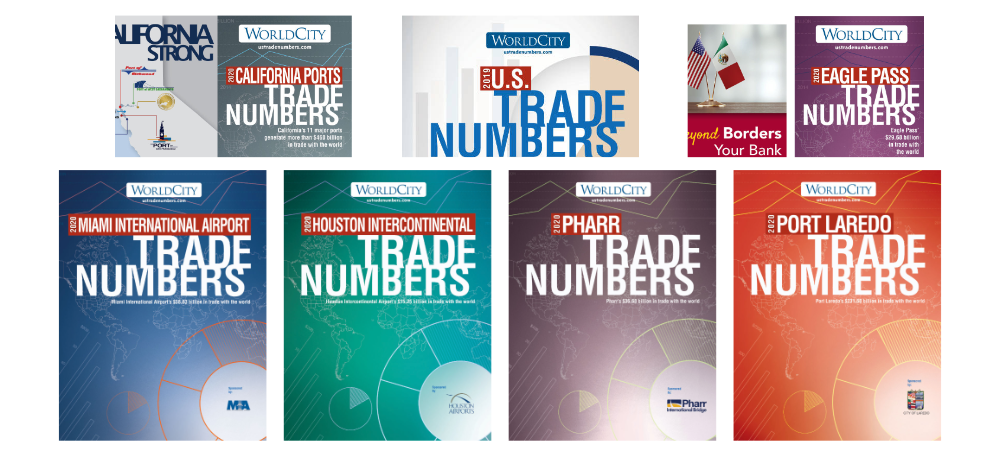
Our TradeNumbers publications offer both a great marketing tool and an encyclopedic internal resource for airports, seaports and border crossings. It’s an editorial product that is the precursor to this website, the first one published in 2001.
We have now produced them in every corner of the country, from our home in Miami to Seattle, from Los Angeles to New York, and many points in between. New Orleans, Laredo, Philadelphia, Jacksonville, Norfolk, Hueneme, Pharr, Dallas-Fort Worth, Houston, Puerto Rico and many more.
We have produced U.S. TradeNumbers also, focused on U.S. trade with the world. We have produced them to showcase U.S. trade with other countries, including China, Mexico, Costa Rica and others. We have produced them for perishables, for high-technology products, for the Americas.
We have published them in English and in Spanish.
We now produce them in three formats: the full magazine, generally 64 pages; the Executive Summary, generally produced as a fold-out poster-sized product; and the pocket-sized Pamphlet, made to fit into a jacket pocket or purse.
For existing publications, there are advertising and sponsorship opportunities. For new markets, we first seek sponsors. Sponsors get their logo on the Front Cover, a full page in the best premium position available at commitment, including the Back Cover, and up to 2,000 copies. Advertisers receive a box of publications, generally 45-50 copies in addition to their full-page color ad.
Contact us at 305-441-2244 or at info@ustradenumbers.com for more information.